Getting Meshtastic Telemetry into InfluxDB with Node-RED
I run a small Meshtastic mesh network out of Benicia, CA. Five nodes, a mix of fixed and mobile hardware, with the gateway publishing packets to an MQTT broker on my NAS. I wanted the telemetry - battery levels, signal quality, GPS positions, environmental sensors - flowing into InfluxDB and visualized in Grafana. This post covers how I built the pipeline and the specific problems I hit along the way.
The Hardware
Five nodes make up the mesh:
- Mesh Gateway (
!9c5026a0): RAK4631 on a RAK19001 Base Board with RAK13800 Ethernet module and RAK19018 PoE module. Network-attached via Ethernet, powered over PoE, 2dBi rubber antenna. Acts as a router and the MQTT uplink to the rest of the network. - Solar Router (
!a033d26a): RAK4631 on a RAK19007 Base Board with RAK1921 OLED display, RAK12501 GNSS module, RAK1904 accelerometer, and 2dBi rubber antenna. Housed in a WisMesh Unify Enclosure. Solar-powered, acts as a relay node. - Sensor Node (
!06c86404): TLora V2.1.1.6, fixed position at home, GPS locked at 114m altitude. - Mobile Alpha (
!6c73c608): T-Beam in a 3D printed enclosure, carried mobile. - Mobile Beta (
!f9cf825a): T-Echo with BME280 environmental sensor (temperature, humidity, pressure), carried mobile.
The gateway publishes all received packets to a Mosquitto MQTT broker running on my NAS. Topic pattern: msh/#.
The Stack
- MQTT broker: Mosquitto (Docker, on the NAS)
- Node-RED: Docker container, with
@meshtastic/node-red-contrib-meshtasticandnode-red-contrib-influxdbpackages - InfluxDB: v2.7, bucket
meshtastic - Grafana: for visualization
Node-RED sits between MQTT and InfluxDB. Every packet the gateway receives gets forwarded to MQTT, and Node-RED decodes it, routes it by type, and writes the relevant fields to InfluxDB.
Decoding Meshtastic Packets
Meshtastic packets are Protocol Buffer encoded. The outer envelope is a ServiceEnvelope containing a MeshPacket, whose payload type depends on the portnum field. Getting this decoded correctly in Node-RED was the hardest part.
I tried node-red-contrib-protobuf and node-red-contrib-pbf - neither handled the nested two-level decode reliably. What actually worked was the official @meshtastic/node-red-contrib-meshtastic package. It ships a decode node that handles the full ServiceEnvelope including inner payload decoding by portnum. Install it via Manage Palette in Node-RED.
One important detail: the MQTT input node must be configured with datatype: buffer, not string. The MQTT payload is raw binary - letting Node-RED parse it as a string corrupts the bytes before they reach the decode node.
The Flow
The ingest subflow handles the full decode pipeline:
MQTT In (buffer) → decode → Deduplicate by ID → Translate to Hex IDs → Inject Node Names
The deduplication step is worth calling out. Meshtastic packets get rebroadcast by router nodes, so the same packet can arrive at the gateway multiple times from different paths. A function node maintains a TTL cache (5 minutes) of recently seen packet IDs and drops duplicates before they hit InfluxDB.
After ingest, decoded packets fan out three ways before the main switch:
Decoded packet ──┬── Mesh measurement (all packets)
                 ├── Packet measurement (all packets)
                 └── Split by PortNum (switch)
                         ├── 3  (Position)    → Position subflow
                         ├── 4  (NodeInfo)    → Add Node Info to Global Context
                         ├── 67 (Telemetry)   → Telemetry Type switch
                         │         ├── deviceMetrics    → Device Telemetry subflow
                         │         └── environmentMetrics → Environment Telemetry subflow
                         └── [others]         → debug nodes
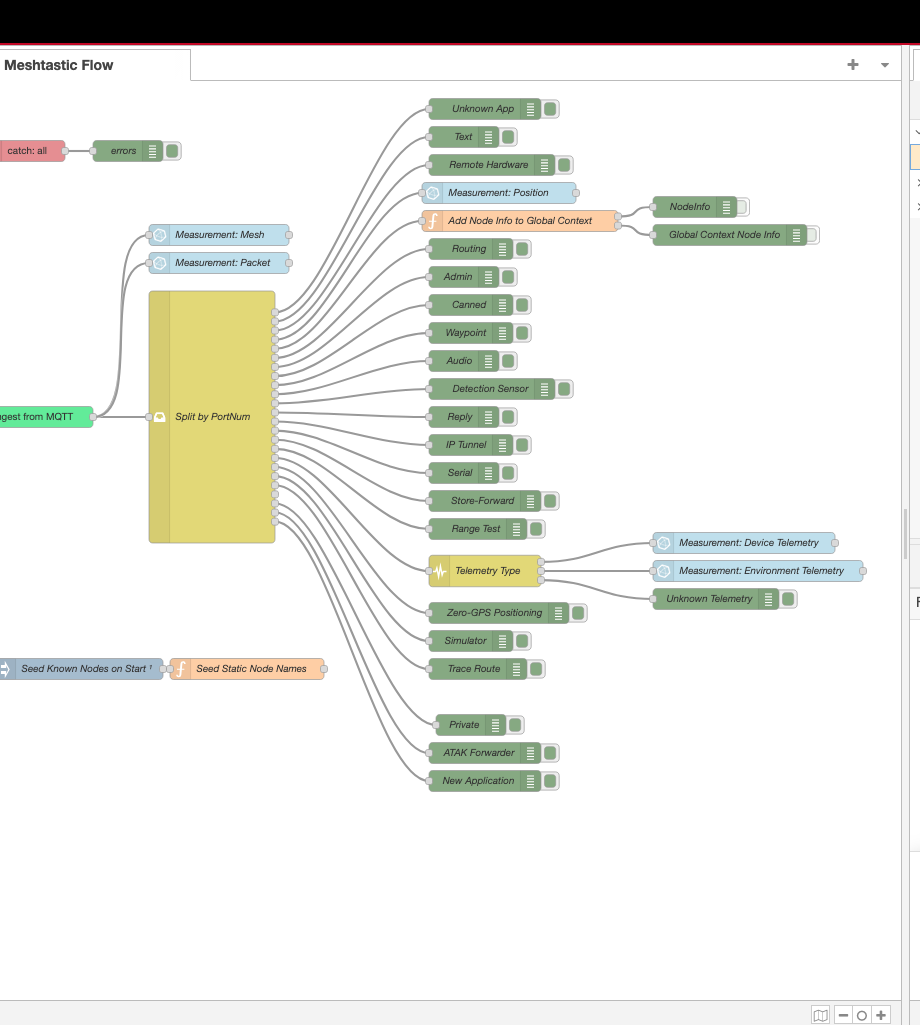
The Split by PortNum switch checks msg.payload.packet.decoded.portnum. The @meshtastic package returns portnum as a number, not the string enum name, so the cases are numeric: 3 for Position, 4 for NodeInfo, 67 for Telemetry.
Node Names in Global Context
NodeInfo packets (portnum 4) contain the long name, short name, and hardware model for each node. A function node stores this in Node-RED’s global context keyed by node ID. Downstream subflows look up fromLongName for any packet by its hex ID.
The flow also seeds the global context on deploy via an inject node that fires once with a 0.5s delay. This means node names show up correctly in Grafana even before a NodeInfo packet has been received in the current session:
const knownNodes = {
  '!9c5026a0': { short: 'MGWY', long: 'Mesh Gateway',  hw: 9 },
  '!06c86404': { short: 'SENS', long: 'Sensor Node',   hw: 3 },
  '!6c73c608': { short: 'MOBA', long: 'Mobile Alpha',  hw: 4 },
  '!a033d26a': { short: 'SOLR', long: 'Solar Router',  hw: 9 },
  '!f9cf825a': { short: 'MOBB', long: 'Mobile Beta',   hw: 7 }
}
Telemetry Routing
Telemetry packets (portnum 67) have a sub-type. The Telemetry Type switch routes on the presence of keys in msg.payload.packet.decoded.payload - deviceMetrics for battery/voltage/utilization data, environmentMetrics for temperature/humidity/pressure.
Issues Along the Way
The priority type conflict. The priority field in a MeshPacket is a protobuf enum. The decoder returns it sometimes as a string name and sometimes as a number, depending on whether the value matches a known enum entry. Writing it directly to InfluxDB hit a field type conflict when the type varied across packets. The fix: map it explicitly through a lookup table to a new integer field priorityNum and abandon the original field:
priorityNum: ({
  UNSET: 0, MIN: 1, BACKGROUND: 10, DEFAULT: 64,
  RELIABLE: 70, ACK: 120, MAX: 127
})[pkt.priority] ?? (typeof pkt.priority === 'number' ? pkt.priority : 0)
gas_resistance from the T-Echo. The Mobile Beta node has a BME280 sensor. On the T-Echo hardware, gas_resistance always returns 0 - the BME280 variant on that board doesn’t support the air quality measurement. Writing a constant 0 to every environment record is noise. The fix: skip the field when the value is falsy:
if (e.gasResistance) fields.gas_resistance = e.gasResistance
Packets with no GPS fix. Position packets from nodes that haven’t acquired a lock arrive with latitudeI and longitudeI both set to 0. Writing 0,0 to InfluxDB (coordinates in the Gulf of Guinea) pollutes the position data. The fix: drop any position packet where both are zero:
if (!p.latitudeI && !p.longitudeI) return null
InfluxDB Schema
All measurements share a common set of tags:
from, fromShortName, fromLongName, fromHardware,
to, toShortName, toLongName, toHardware,
channelId, gatewayId
Measurements and their key fields:
| Measurement | Fields |
|---|---|
| Device | battery_level, voltage, channel_utilization, air_util_tx |
| Environment | temperature, relative_humidity, barometric_pressure |
| Position | latitude, longitude, altitude, satsInView, groundSpeed |
| Packet | rxSnr, rxRssi, hopLimit, priorityNum, delayed |
| Mesh | id, source, target, rxSnr, rxRssi |
Grafana
With telemetry flowing into InfluxDB, Grafana dashboards come together quickly.
Renaming series by node name. InfluxDB Flux queries return series with names like _value battery_level. Grafana shows these with the _value prefix by default, which makes legends unreadable when you have multiple nodes. The fix: use the “Rename fields by regex” transformation with match _value (.*) and replacement $1. This strips the prefix and leaves just the node name from the fromLongName tag.
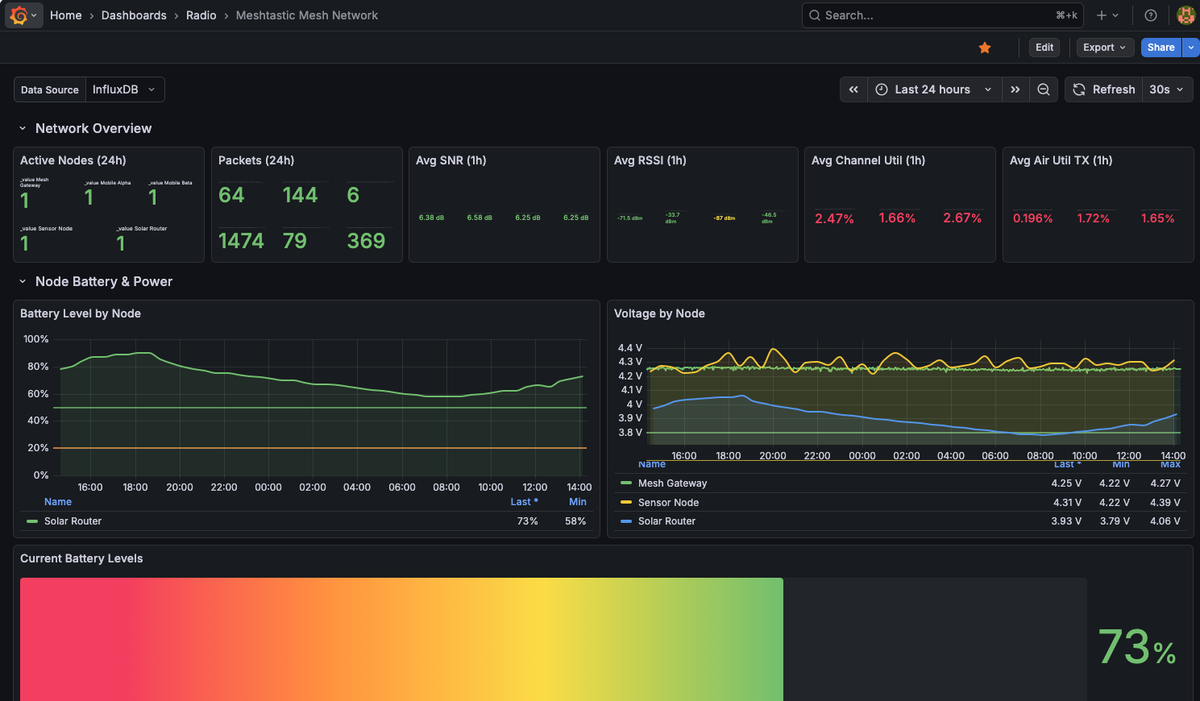
The dashboard has four sections:
Network overview - active node count, 24-hour packet totals, and rolling 1-hour averages for SNR, RSSI, channel utilization, and air utilization TX across all nodes. In practice SNR sits around 6-7 dB and RSSI around -50 to -87 dBm depending on which node is transmitting. Channel utilization stays well under 5% across the mesh.
Battery and power - voltage and battery percentage time series per node. The Solar Router voltage fluctuates between 3.79V and 4.06V as the panel charges and the battery discharges overnight. The Mesh Gateway (wall-powered via PoE) stays steady at 4.22-4.27V.
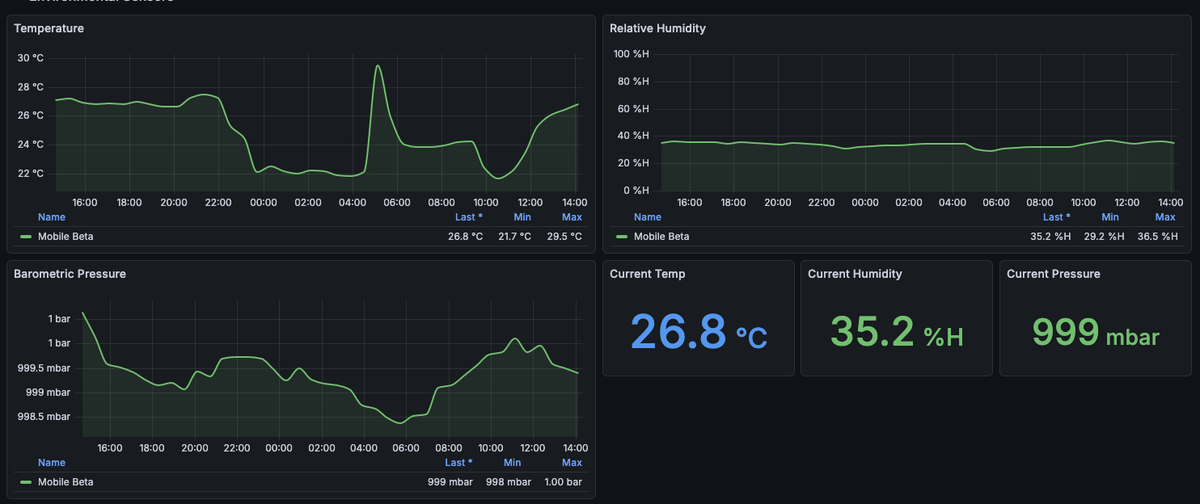
Environmental sensors - temperature, humidity, and barometric pressure from Mobile Beta’s BME280. Temperature shows a clear diurnal cycle: 22°C overnight, rising to a 29.5°C peak in the morning, settling back to 27°C by afternoon. Pressure holds steady around 999 mbar.
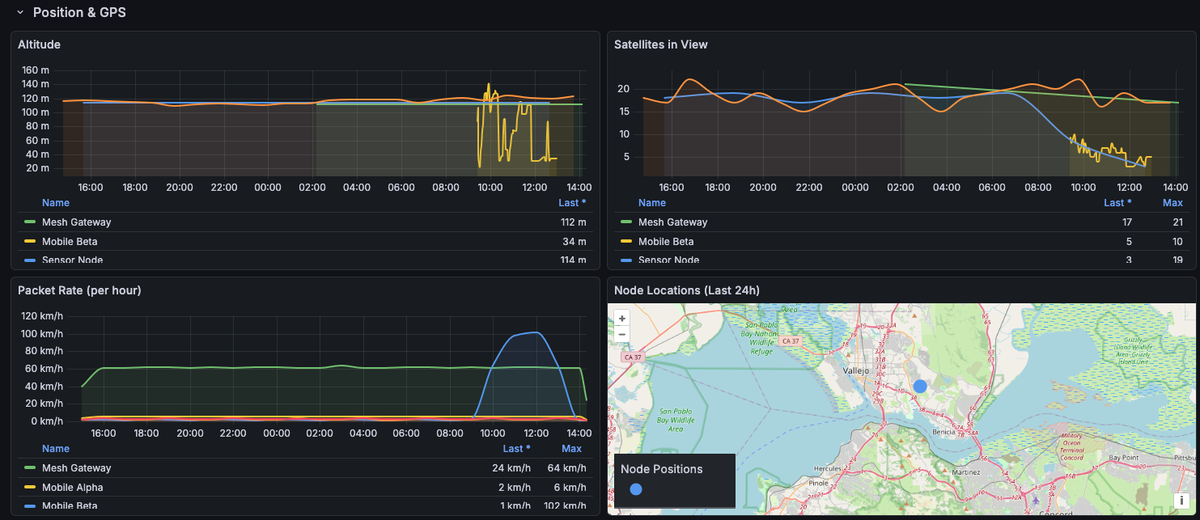
Position and GPS - altitude, satellites in view, and a map panel showing node locations. The fixed nodes (Gateway and Sensor Node) hold steady at ~112-114m. Satellites in view gradually trends down on the Sensor Node over 24 hours - worth investigating.
The Flow JSON
The complete Node-RED flow is available here. A few things to update for your own setup:
- MQTT broker address
- InfluxDB URL, org, bucket, and auth token
- Node IDs and names in the seed function
Required Node-RED packages: @meshtastic/node-red-contrib-meshtastic and node-red-contrib-influxdb. Install both via Manage Palette before importing the flow.
What’s Next
The pipeline is working well. A few things I’d like to add:
- Neighbor info. PortNum 71 (NeighborInfo) carries SNR between node pairs - useful for visualizing which nodes can hear each other. The output wire in the switch exists but isn’t connected to anything yet.
- A second gateway node. I’m planning to add a second RAK4631 connected to the public LongFast mesh (via
mqtt.meshtastic.org) as a separate, isolated network for map reporting and public mesh participation.